ReFine HDR · Detail report
Scoring AI Editors on Detail Quality
Four AI real estate editors, measured against printed test charts in three furnished interiors. Between 2% and 7% of a 60-megapixel capture survives the round trip.
Disclosure. ReFine HDR does not take any money from AI editors, but our business centers on AI image quality, so we do have a stake in these tests. To be as transparent as possible, the method below is spelled out in full, so anyone can check our work.
Contents/ 11 sections
Introduction
In the last two years, AI editing has upended the real estate photography industry. While online opinion seems sharply split about the value of AI editing, there's little disagreement that AI editing certainly has a few specific giveaways, and none more so than the degradation of detail. We set out to put numbers to that degradation and score the AI editors based on their detail retention, sharpness and noise. Here's what we found:
The short version
- The images AI editors deliver max out at roughly 1 to 4 megapixels of real detail, whether the image they send back to you is 15MP or 60MP. We'll refer to this as an image's “Effective Resolution” from here on.
- Sending larger files to the editor doesn't necessarily improve image quality. A 15-megapixel JPEG returns the same detail as a 60-megapixel one. This is true for RAW files as well.
- Three of the four editors deliver very similar real detail, while varying widely on noise and other image quality factors.
| Editor | Effective resolution (MP) | Of a 60MP upload retained |
|---|---|---|
| AutoHDR v4 | about 4.3 | 7% |
| AutoHDR Classic | about 4.0 | 7% |
| RealtyEdit | about 3.7 | 6% |
| Fotello | about 1.2 | 2% |
What “effective resolution” means. Every number in this report attempts to answer one question: strip away the upscaling, and how much of your camera's detail is actually left in the file you got back? We work it out by building a resolution scale from the original photo. The full method, both test charts and all the controls are at the end of this report.
What the ranking means
Each figure is the average of 11 measurements across three scenes. The margin is about 0.7MP either way for the top three and 0.2MP for Fotello.
Three AI models score within one standard deviation of each other. For those editors, detail is close enough to be considered effectively a tie, even if those details look very different from each other. Fotello is a different story. It came in 44% to 45% below the other three on every single target we measured, in every scene, at every upload size. That gap is less ambiguous.
Three models score very closely. Why?
To save on compute costs and time, AI editors downsize your images before they run them through the model. This is why sending larger images doesn't improve output photo quality. Part of this exercise is to estimate how much downsizing each editor does.
So why do AutoHDR and RealtyEdit land around 4MP of effective resolution?
Standard MLS dimensions are 2048x1536, or 3.1MP. Our best guess is that most editors are optimizing their models for slightly above MLS quality.
We tested the resize directly. Take the camera's original file, shrink it to about 2,800 pixels on the long edge, stretch it back to full size, and measure it. No editor involved at all. That plain resize matches both AutoHDR models on the star chart almost exactly, both in resolution limit and in texture. The resize sets the ceiling, and whatever the model does after that is working inside a box that's already been drawn.
Upload size doesn't matter
When it comes to AI editing, larger input files don't improve quality. They do add to your upload time. Consider using a smaller JPG size in-camera to save on upload time and drive space.
RAW files don't necessarily improve detail. For two of the four models it came back a touch softer than the JPG, though the difference was inside our margin.
Our guess is that the JPG picks up some in-camera sharpening the RAW doesn't, but we haven't tested that directly, so treat it as a guess.
Separating detail and texture
The second of our two test charts is a Siemens star: a printed circle of spokes that get finer toward the center, which is the standard way lenses and sensors are tested. This allows us to measure local contrast past an image's effective resolution point.
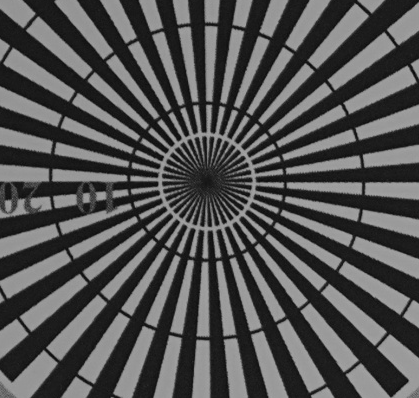
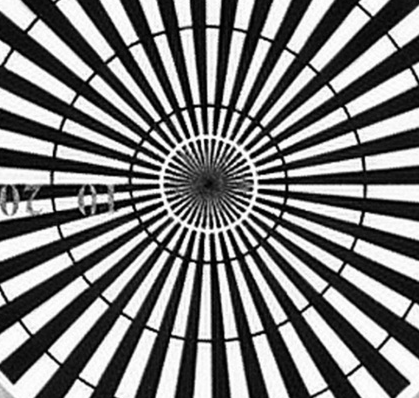
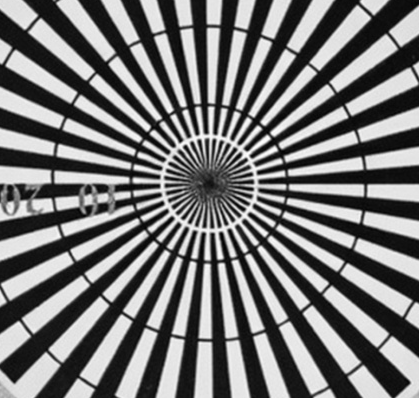
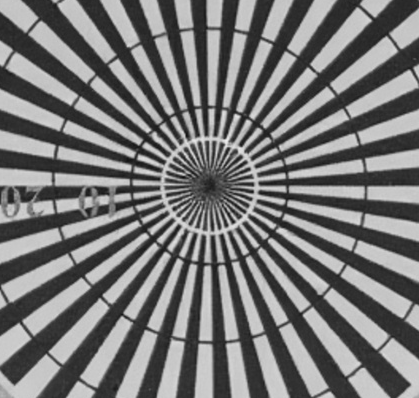
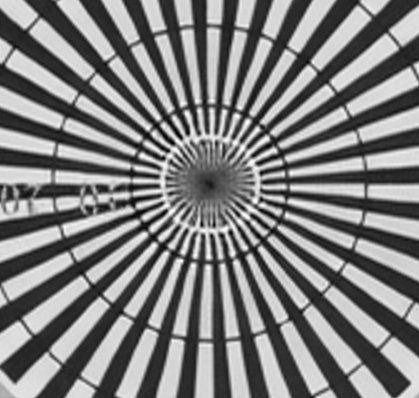
The three leaders stop resolving at the same point. However, they do not draw the detail above that point with the same conviction. Call the second number texture: it is roughly the same thing Lightroom's texture slider acts on, measured on a fine repeating pattern rather than judged by eye. RealtyEdit keeps about 30% less texture than either AutoHDR model, across everything all three can still show.
This is not a stand-in for exposure or overall contrast. The measurement is normalized to the local brightness of the patch it sits in, so making the image lighter or darker cannot move it, and RealtyEdit's figure held in all seven scene-and-upload combinations we measured it in.
That makes RealtyEdit's output look softer, and it is softer. But it isn't lower resolution, and the difference matters in practice. Texture comes back with a slider. Detail past the resolution limit doesn't come back at all, from any slider, in any program.
So “which editor is sharper” is the wrong question. The right one is which editor still has the detail, and separately, how boldly it chose to render it.
Noise and sharpening
While detail preservation is the main driver of quality, two worth measuring are noise and sharpening, and they are the two sides of the same coin. Without masking, increasing sharpening increases noise. Conversely, noise reduction also reduces sharpness.
We establish a baseline by creating a downscale-upscaled original at 2800px on the long edge, roughly where our three close models sit. That's the dashed tick on each axis below, and it's how we can tell which effect is caused by the editor and which is simply a result of resizing.
Noise kept: higher means more of the camera's original grain is left
Camera1.00Resize alone0.43AutoHDR v40.45Fotello0.30AutoHDR Classic0.22RealtyEdit0.17
Downsampling an image averages neighboring pixels together, and that removes most of the grain for free. So AutoHDR v4, at 0.45, is doing no denoising of its own at all. Every bit of smoothing in its output came from the resize. RealtyEdit at 0.17 removes about 60% of what the resize left, and it's the most aggressive denoiser of the four.
Neither end of that range is automatically better. Grain you can remove later. Texture that got smoothed away with it, you can't.




Halos: lower is closer to the camera, and everything above 1.0 is the editor's sharpening
Camera1.00Resize alone0.85RealtyEdit1.25AutoHDR Classic1.35Fotello1.81AutoHDR v41.82
Halos are the bright and dark fringes along high-contrast edges: the pale glow just inside a window frame, the dark line where a ceiling meets a wall. They are the most obvious indicator of oversharpening, which is why we score sharpening based on halos rather than edge contrast alone.
The resize lands below the camera at 0.85, because resizing softens edges rather than hardening them. There is no path from a resize to a halo, so every point above 1.0 is sharpening the model chose to apply.
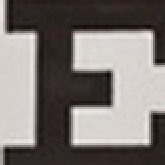
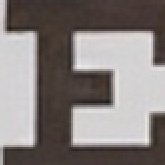
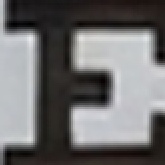
How noise and sharpness influence quality
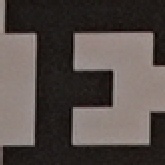
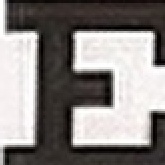
AutoHDR v4 sharpens the hardest, keeps the most grain and has the most prominent halos, which is itself a style decision. RealtyEdit takes the opposite approach, leaning more towards soft details and low noise. AutoHDR Classic sits somewhere in the middle.
Fotello is the odd one out. It has the second-worst halos while barely sharpening at all by this measure.
Taken together, the above charts highlight the thing that surprised us the most: how different images can be even when they have roughly the same level of detail.
What we didn't measure
These charts measure how much of what your camera captured survives the editor. They don't measure taste, tone, or whether you like the look. An editor could score well here and still produce images you'd never deliver.
Color accuracy and white balance were measured in the same sessions and will get their own post.
Exteriors. All of the results in this report were collected by testing on interiors. A proper exterior comparison needs its own set of test data, which we have not yet collected or processed.
Where ReFine comes in
This is the part we build and sell, so weigh it accordingly.
Everything above describes the same problem from different angles: the detail you captured doesn't survive the trip through an AI editor. But it isn't gone. It's still sitting in your original brackets, untouched.
ReFine takes the editor's finished image and restores the real detail from your brackets back over it, pixel by pixel. We ran it on all four editors' output from the same uploads and scored the results on the same ladder.
Every editor goes from 1 to 4 megapixels of real detail to roughly 9 to 15. All four end up in the same neighborhood, which is the point: the detail is coming from your brackets, not from a model, so it doesn't much matter which editor produced the file underneath (at least in terms of detail). Measured across the four editors and the four upload sizes, the upload size accounts for about twice as much of the remaining variation as the editor does.
Halos drop to or below the camera's own level for AutoHDR Classic and RealtyEdit, and from 1.8 down to about 1.0 for AutoHDR v4 and 1.2 for Fotello. Contrast returns to camera level for both AutoHDR models and most of the way back for the other two. Grain evens out across all four, which is worth a chart of its own.
If you only remember three things
If you don't plan on restoring detail with ReFine, upload the smallest JPG your camera will shoot. There is no quality loss, and you'll save time and hard drive space.
If your editor's output looks soft, it's often recoverable with texture/sharpening. If it looks suspiciously clean, look for invented detail.
If you want the detail from your brackets back, that's what we built ReFine to do.
The downscale-upscale ladder
Our test camera shoots large JPGs at 60.2 megapixels, or 9504 pixels on the long edge. Shrinking the image to 1.1MP (1280px on the long edge) throws away about 98% of the original pixels. If we upscale that 1.1MP back to 60.2MP, we now have an image that is the exact same size as the original, but with just 1.8% of the original pixel information. Simple enough so far. We repeat this process at 13 sizes to get our downscale-upscale ladder. Each image on the ladder is 60.2MP, but contains less detail at every lower rung. Here's what that looks like:
| Long edge | Dimensions | Megapixels | Pixels kept | Pixels lost |
|---|---|---|---|---|
| 9,504 | 9504 × 6336 | 60.2 | 100% | 0% |
| 8,000 | 8000 × 5333 | 42.7 | 70.9% | 29.1% |
| 6,240 | 6240 × 4160 | 26.0 | 43.1% | 56.9% |
| 5,000 | 5000 × 3333 | 16.7 | 27.7% | 72.3% |
| 4,160 | 4160 × 2773 | 11.5 | 19.2% | 80.8% |
| 3,640 | 3640 × 2427 | 8.8 | 14.7% | 85.3% |
| 3,120 | 3120 × 2080 | 6.5 | 10.8% | 89.2% |
| 2,560 | 2560 × 1707 | 4.4 | 7.3% | 92.7% |
| 2,080 | 2080 × 1387 | 2.9 | 4.8% | 95.2% |
| 1,600 | 1600 × 1067 | 1.7 | 2.8% | 97.2% |
| 1,280 | 1280 × 853 | 1.1 | 1.8% | 98.2% |
| 1,080 | 1080 × 720 | 0.8 | 1.3% | 98.7% |
| 800 | 800 × 533 | 0.4 | 0.7% | 99.3% |
Every rung is the camera's own frame, shrunk to the long edge shown and stretched back to full size. Each one is a 60.2MP file carrying only the detail of its rung.
The ladder gives us a reference for how much pixel information is lost at each rung. In order to estimate how much downscaling the editors are doing, we simply compare the 60.2MP images they return to each rung of the ladder. If AutoHDR's closest match is at 4.4MP, that's its effective resolution. In practice, we interpolate between rungs to get more precise estimates. On average, AutoHDR's Classic model returned images that landed at 4.0MP interpolation.
One caveat on the absolute numbers. Using a different resampling method to build the ladder shifts the nominal size by about 10%. The pixel counts here are for a bicubic resize.
How can we measure real detail?
The downscale-upscale ladder gives us a way to estimate how much pixel information the editors retain, but pixel information is not the same thing as detail. In order to score detail preservation we first had to find a metric that couldn't be fooled by sharpness, noise or AI upscaling.
The eye chart
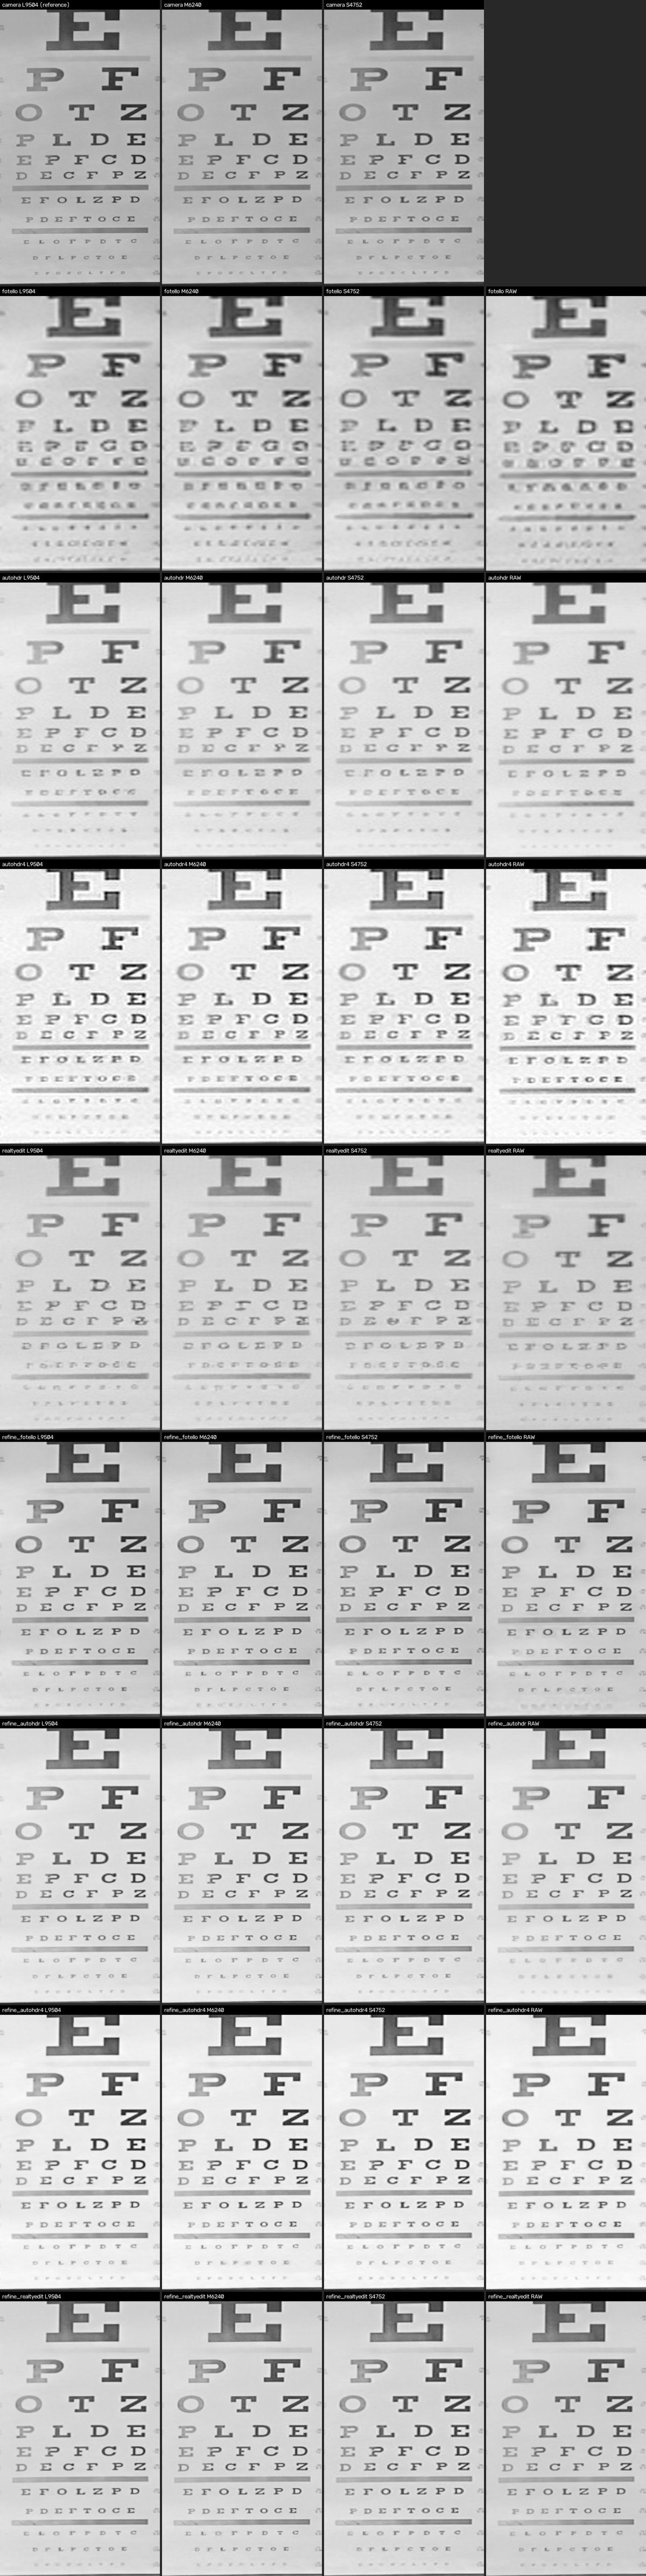
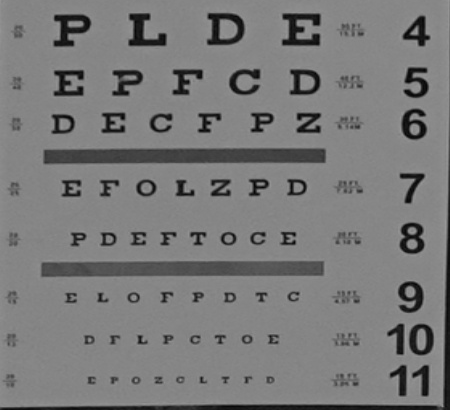
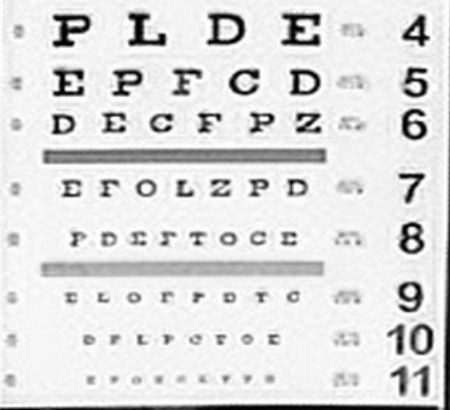
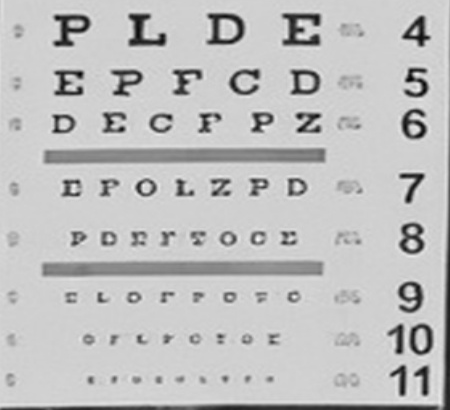
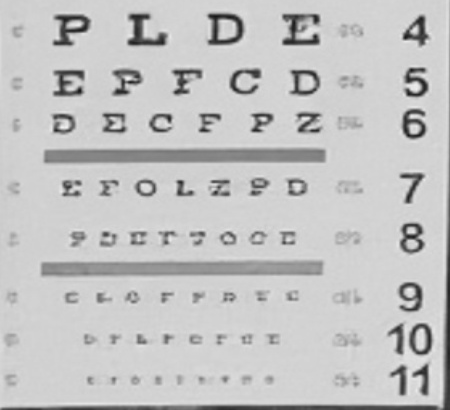
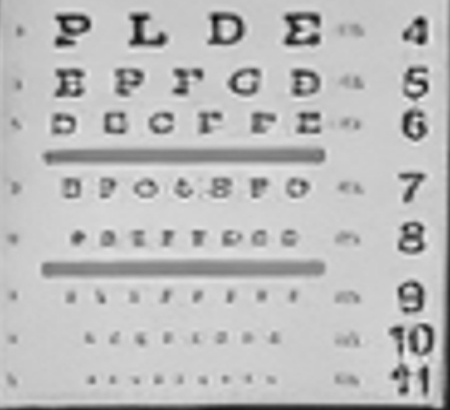
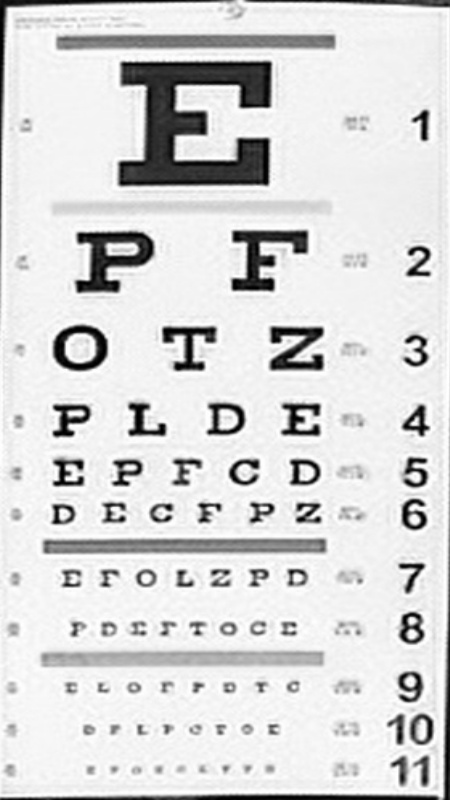
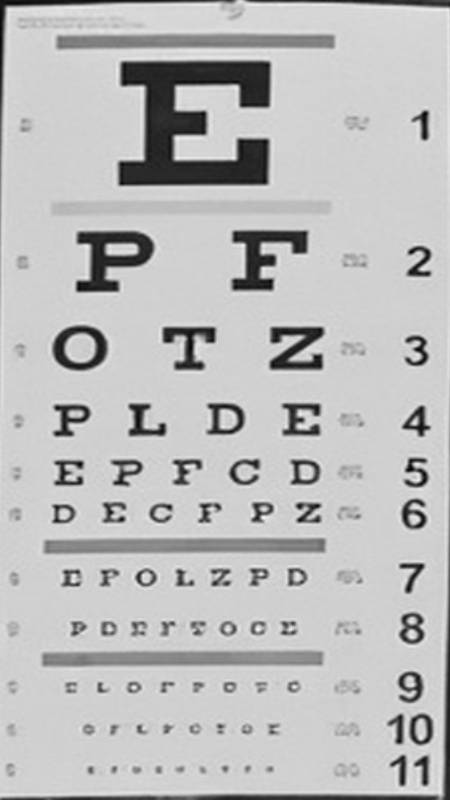
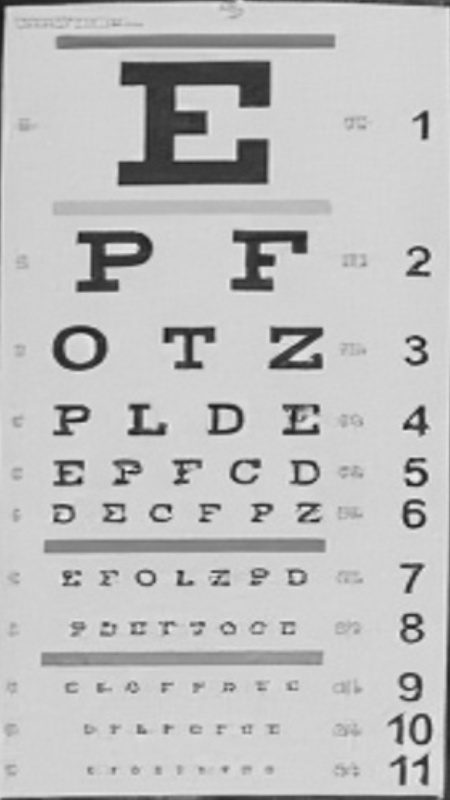
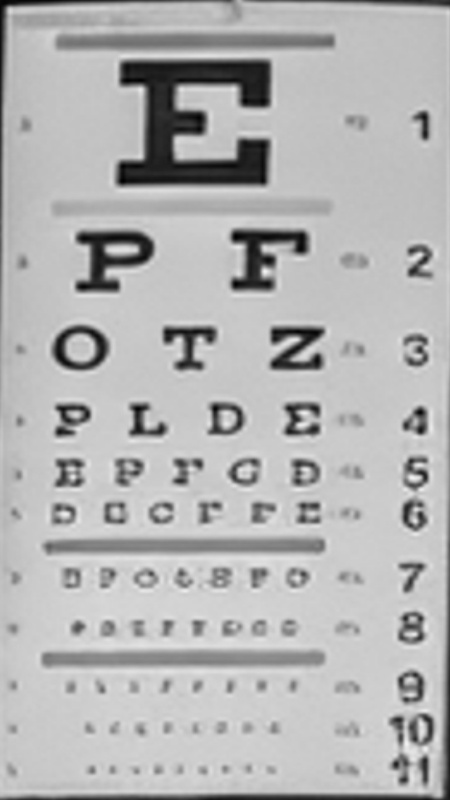
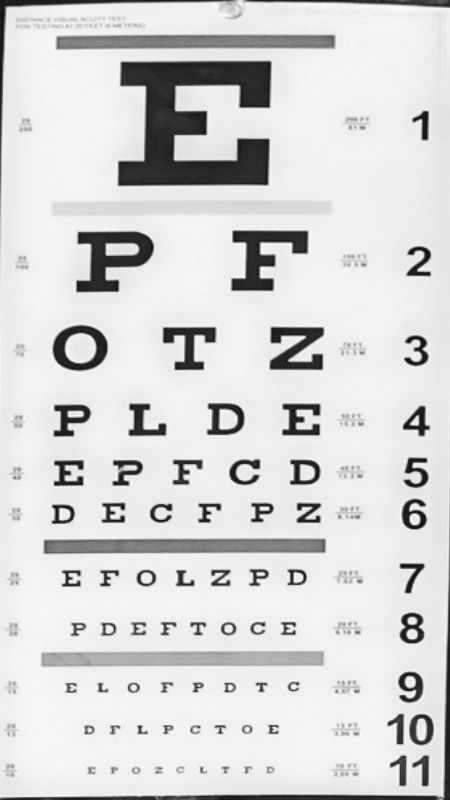
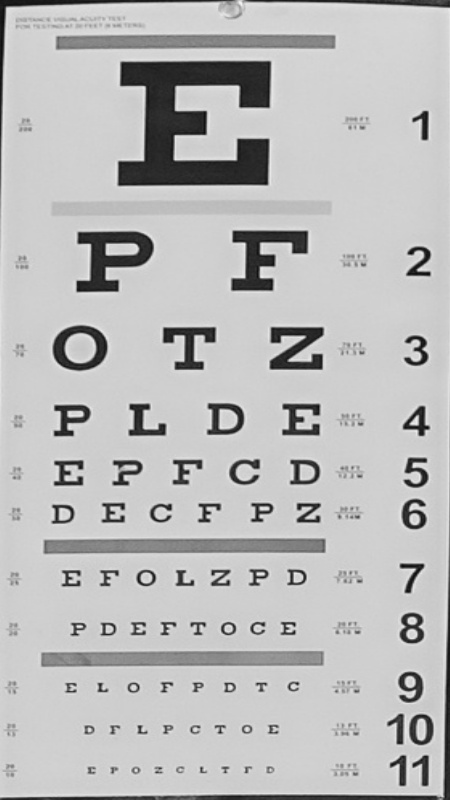
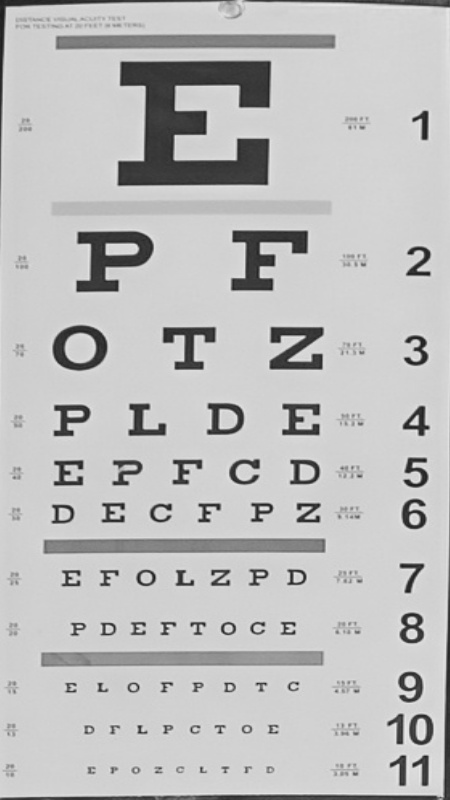
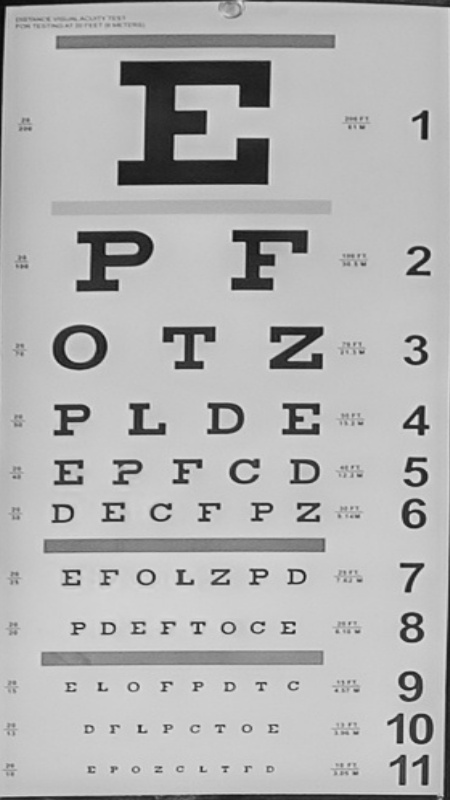
Our first metric is an ordinary optician's eye chart, placed in a typical interior real estate scene and photographed like a typical bracket. The eye chart results offer a simple way to visually compare editor detail, but we can also use the results to measure detail correlation between the editor's version and the original image.
When we compare detail for an AI-edited image on the downscale-upscale ladder, we restrict the comparison area to just the details in the eye chart. Each row from 3 through 11 gets its own score, and those 9 rows are averaged to give us the image's detail score.
That score asks one question: “Are these the same shapes?” It doesn't care about brightness or contrast. An editor that blurs the letters scores badly. An editor that invents crisper letters of the wrong shape scores badly too. There's no way to sharpen or fabricate your way to a higher number.
We ran this test across multiple input resolutions, scenes and file formats for each editor. The comparison it produces is Fig. 2.
The star chart
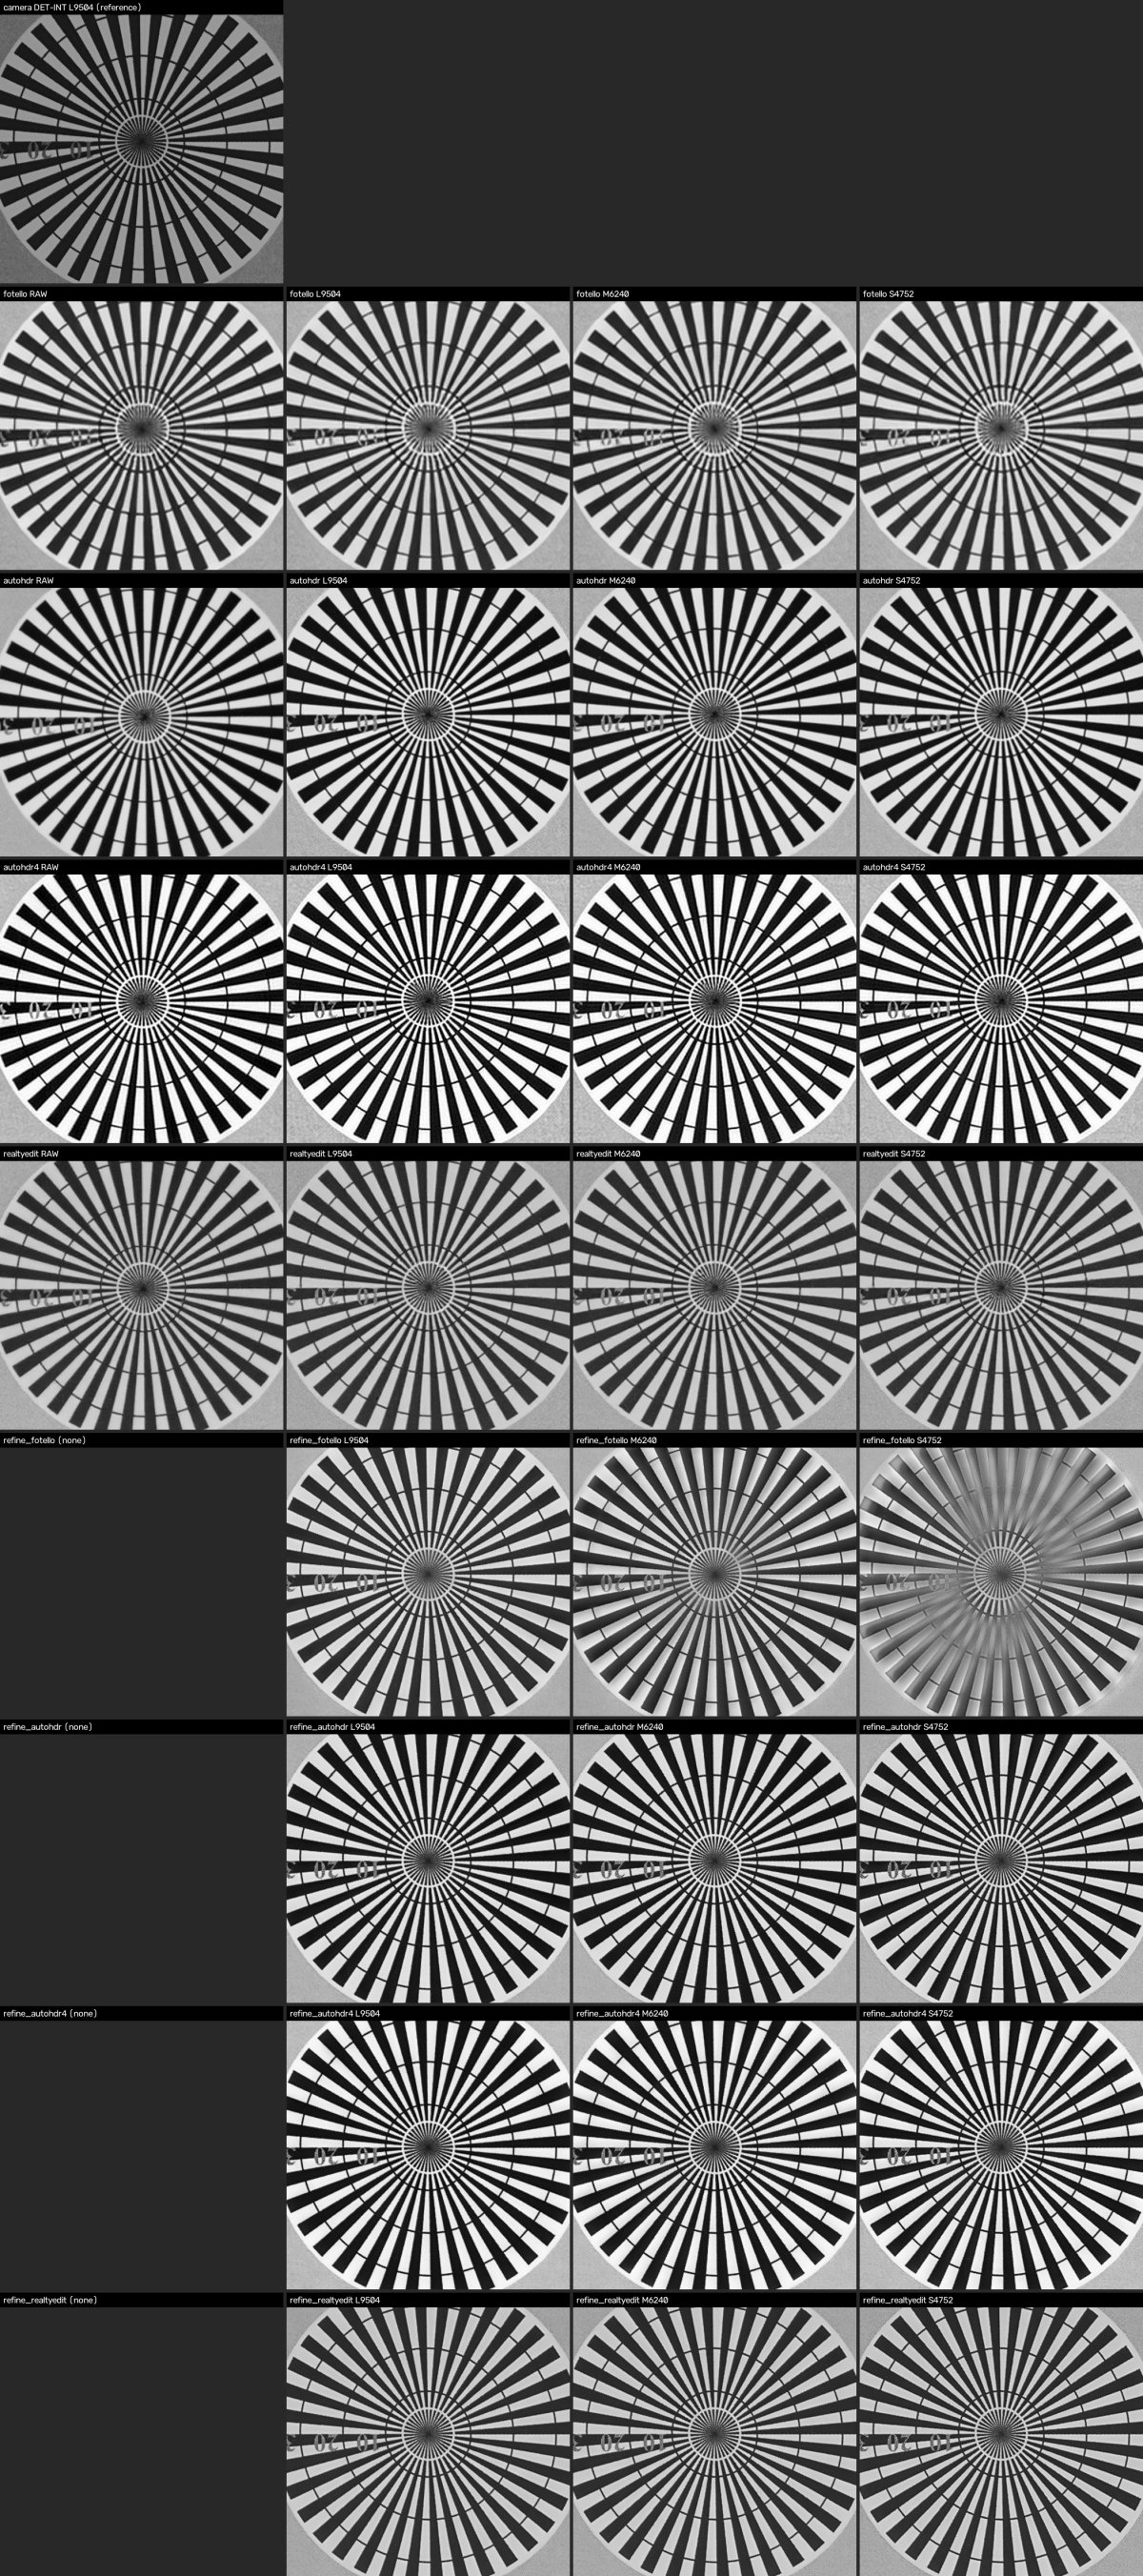
A Siemens star is a printed circle of 36 black and white spokes that meet at the center, so the pattern gets finer the closer in you look. It's a standardized way to measure how much a lens or a sensor can resolve, and it works just as well on an editor's output.
We sample the image around a series of rings at decreasing radius and measure how much of the 36-cycle pattern survives at each one. That gives us a curve of contrast against fineness, allowing additional control over two factors: sharpening can boost spokes that are still there, but it can't bring back spokes that have already merged into gray, because there's nothing left to boost. And because we read only the 36-cycle pattern, amplified noise doesn't count as detail.
The chart has four stars, one near each corner of the frame. We measure each one and take the median, so a single shaded or misaligned star can't swing the result.
Each curve gives us two numbers. The resolution limit is the point where the spokes stop being separate lines and turn into gray. Anything finer than that is gone. It's the smallest thing the editor can still show. Texture is a different question: for all the spokes coarser than that point, how boldly are they drawn? Two editors can lose the spokes at exactly the same place and still look very different, because one draws everything above that point crisply and the other draws it faintly. The comparison it produces is Fig. 4.
Upload sizes, repeat uploads and controls
Testing differences in uploaded image size
One eye-chart scene was shot at the camera's three JPG sizes (9,504, 6,240 and 4,752 pixels wide) and as RAW, so the same scene could go to each editor four different ways. Every result was lined up against the camera's original frame and scored on the same downscale-upscale ladder. We measure each file at whatever size the editor delivered, and we never resize an editor's file before measuring it.
Repeat uploads
We sent every editor the same files twice. Three of the four came back within 1% of themselves, and AutoHDR Classic was identical both times. RealtyEdit varied by two to three percent, which is still small enough not to affect any conclusion here, but worth knowing if you're comparing single images.
Testing our ladder against in-camera downscaling
We ran the camera's own smaller JPG sizes (26MP and 15MP) through the 60MP downscale-upscale ladder. They scored 17.7MP and 12.6MP respectively. That points to two things: the camera's internal downsizing uses a different algorithm than ours and produces softer results, and the high end of the ladder is comparing fine detail at a level that's visually indistinguishable on the charts themselves. Neither affects the editor scores, which land much further down the ladder, where it's at its most sensitive.
Appendix: full comparison grids
Two contact sheets, every editor at every upload size, with and without ReFine. They are large; open them when you want to check a specific cell.
Show the full comparison grids